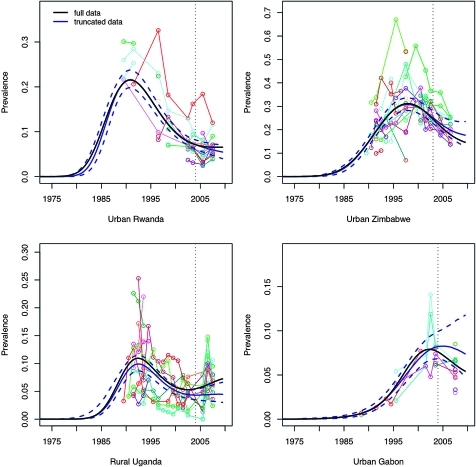
Figure 5.
Median prevalence with 95% credible intervals for out-of-sample prevalence predictions for the spline-based model (in blue), with median fit for the full-sample results added for comparison (in black), for four selected settings. Data for the last 3 years of observation were excluded for generating out-of-sample predictions (denoted by the vertical dashed line).

