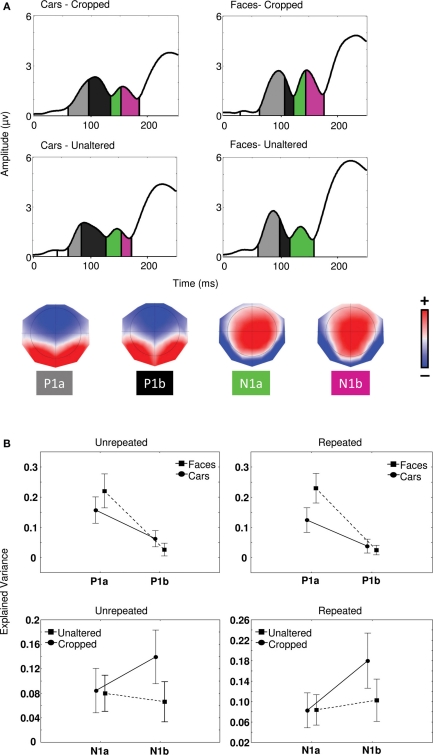
Figure 3.
(A) Global field power waveforms in the four conditions of Experiment 1 segmented by microstate and associated topographies identified by the segmentation procedure (see Materials and Methods). Color scale indicates potentials and ranges from −0.17 to +0.17 μV. (B) Proportion of explained variance by maps P1a and P1b regarding object categories and maps N1a and N1b in relation to cropped and unaltered images.

