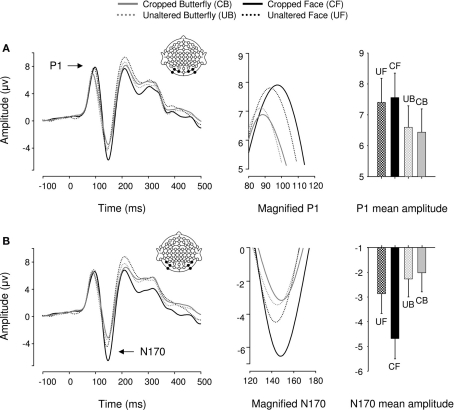
Figure 4.
Event-related brain potential results in the four conditions of Experiment 2. Waveforms depict linear derivations of the electrodes used for analysis of the P1 and N170, respectively. (A) From left to right: linear derivation of electrodes O1, O2, PO7, PO8, PO9, and PO10, magnification of the P1, and bar plot of P1 mean amplitudes. (B) From left to right: linear derivation of electrodes P7, P8, PO7, PO8, PO9, and PO10, magnification of the N170, and bar plot of N170 mean amplitudes. Error bars depict SEM.

