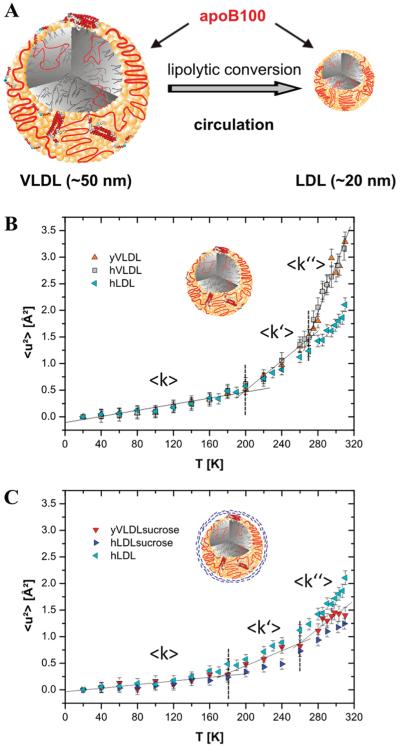
Figure 1.
(A) Scheme of the conversion of VLDL to LDL. (B) Mean square displacements (MSD) describing the dynamics of lipoproteins. hVLDL (gray squares), yVLDL (orange triangle upright), hLDL (blue triangle left). (C) With sucrose (10% w/v) added. yVLDLsucrose (red triangle down), hLDLsucrose (dark blue triangle right). For direct comparison the data of hLDL without sucrose are included. Sucrose surrounding the lipoprotein is mimicked by blue wavy lines. For yVLDL (−/+ sucrose), the temperatures of dynamical transitions (vertical dashed lines) and the regression lines used for evaluation of mean environmental force constants (solid lines) are indicated.

