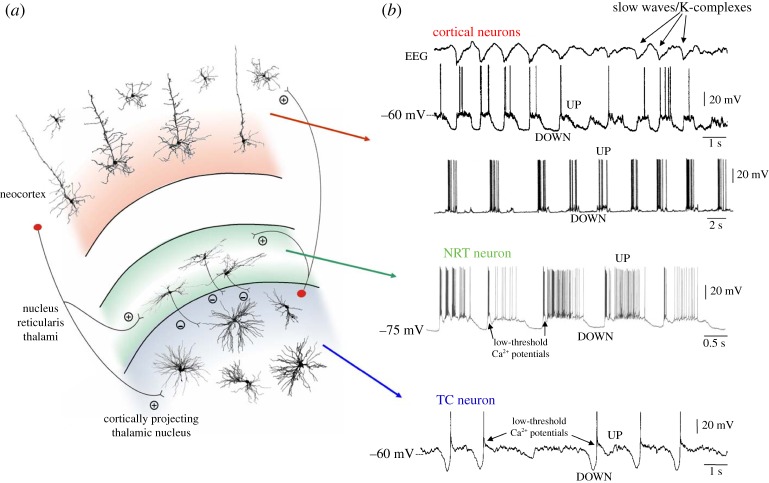
Figure 1.
The EEG slow (<1 Hz) rhythm and its cellular counterpart, the slow (<1 Hz) sleep oscillation, in cortical and thalamic neurons. (a) Diagram of a TC module with its most relevant neurons and synaptic connections (thalamic interneurons and neocortical neurons other than those in layers 4 and 5/6 have been omitted for clarity). Plus and minus indicate excitatory and inhibitory synapses, respectively. (b) The slow (<1 Hz) rhythm in the EEG (top trace) and its cellular counterpart, the slow (<1 Hz) oscillation, recorded in two different cortical neurons and in a TC and NRT neuron in vivo. Black arrows in the NRT and TC traces highlight the low-threshold Ca2+ potential (LTCP) that is invariably present at the start of each UP state in thalamic neurons. Adapted with permission from Crunelli & Hughes [2].

