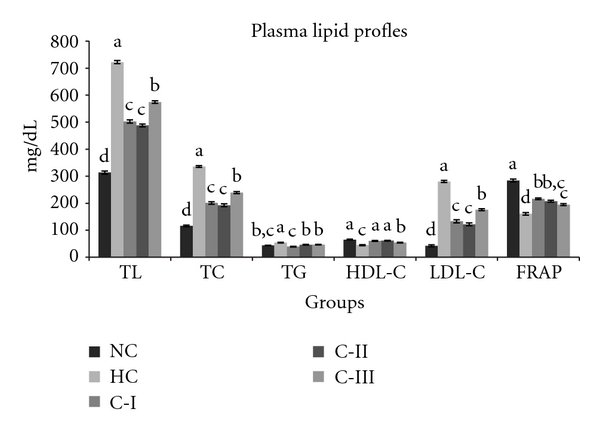
Figure 1.

Effect of feeding different combinations on plasma lipid profiles (mg/dL). NC: normal controls; HC: hypercholesteremic animals; C-I: hypercholesterolemic animals administered with 5 gm% combination-I; C-II: hypercholesteremic animals administered with 5 gm% combination-II; C-III: hypercholesteremic animals administered with 5 gm% combination-III. Values: mean ± SEM and (n = 6); FRAP-value = (μmol/Liter). Significant differences (P < 0.002) among the groups are denoted by a, b, c, and d.
