
Figure 2.
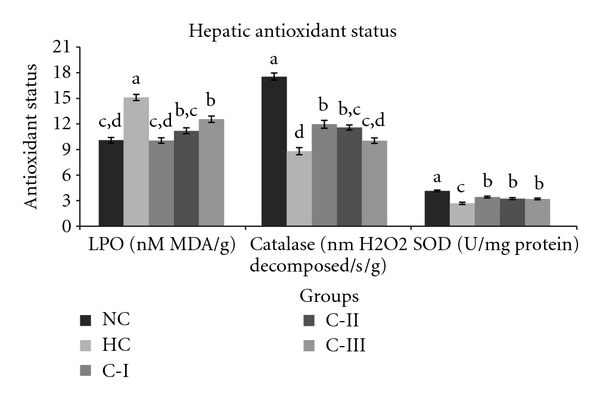
Effect of feeding different combinations on hepatic concentrations of lipid peroxidation (LPO), activities of catalase, and superoxide dismutase (SOD). Values: mean ± SEM and (n = 6). Significant differences (P < 0.002) among the groups are denoted by a, b, c, and d.