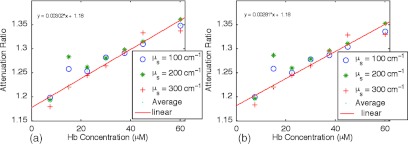
Figure 3.
Calibration curves for estimating total hemoglobin concentration: (a) F500nm/F545nm; (b) F500nm/F570nm. The calibration curves were the attenuation ratio as a function of total hemoglobin concentration. The attenuation ratio is calculated by dividing the fluorescence ratio measured from the turbid phantom by the fluorescence ratio measured from the corresponding optically dilute phantom that contained FAD only. The data points with the legend “Average” are the average of the attenuation ratios for all three scattering coefficients and the corresponding linear fittings are labeled as “linear” in the legend.

