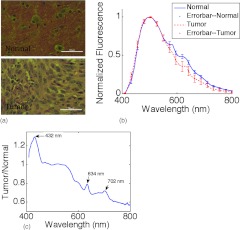
Figure 6.
(a) Representative microscopic images of H&E slices. The scale bars in both images represent 50 μm. (b) Normalized fluorescence spectra of normal tissue (solid line) and brain tumor (dashed line) averaged from all measurements. Error bars indicate the standard deviation of the spectra within each category. (c) Ratio of two fluorescence spectra in (b) wavelength by wavelength.

