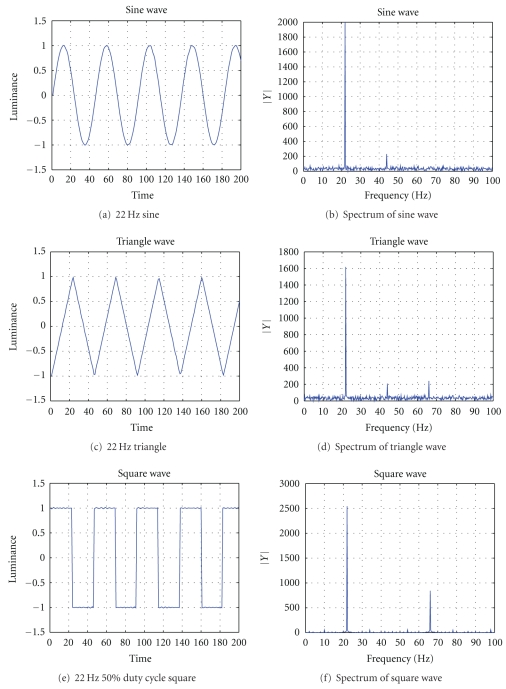
Figure 1.
(a), (c), and (e) are the luminance figures of an LED measured by a Lutron LX-102 light meter. Their corresponding frequency representations are given in (b), (d), and (f), respectively. The spectrum of the square wave strictly adheres to theory, that is, a peak demonstrated at fundamental frequency f as well as a peak at the 3f harmonic. The sine wave and the triangle wave do not. They have weak harmonics that should not exist at 2f. However, these harmonics should not affect the result, since their strength are one tenth that of the fundamental frequency.

