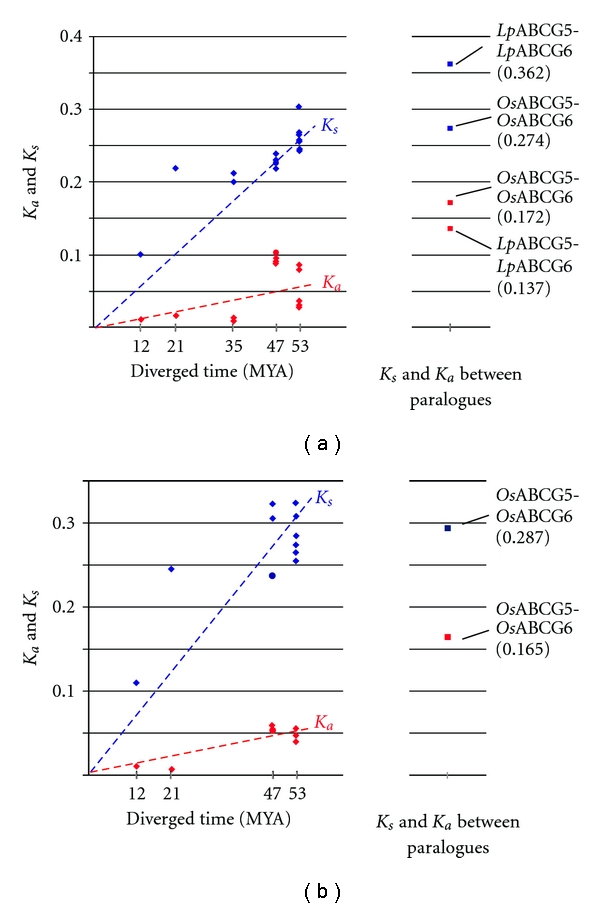
Figure 4.

K a and K s values for the NBD (a) and TMD (b) peptide-coding regions. The K a (red) and K s (blue) values are plotted according to the estimated elapsed times since lineage divergence. The diamond (ABCG5) and circle (ABCG6) symbols denote substitution ratios between orthologous combinations, while square symbols denote substitution ratios between paralogous combinations. Broken lines represent regression plots.
