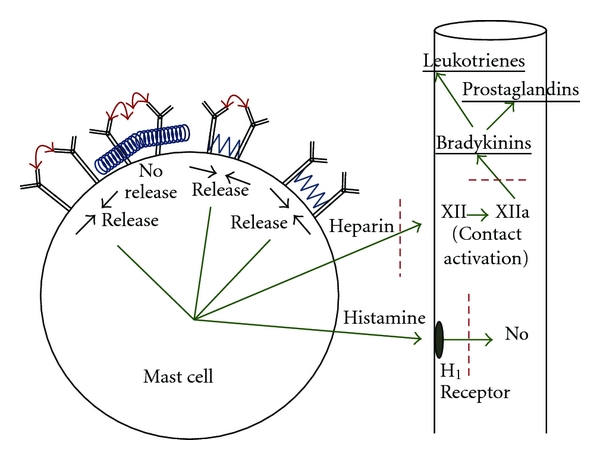
Figure 3.

The mast cell dynamics are depicted. Mast cell release occurs when the IgE receptors aggregate and come closer to one another. IgE on the cell is shown to be bridged by antigens (red arrows) binding to the Fab, segment, resulting in mast cell release. Release also occurs in the presence of antigen attachment plus low concentration CM attachment (blue wave forms). Finally, release occurs when there is low CM concentration attachment alone. High concentrations of CM are thought to act by steric hindrance alone and/or by sterically dislodging bound true antigens. The red dashes represent points of possible corticosteroid inhibitory effect.
