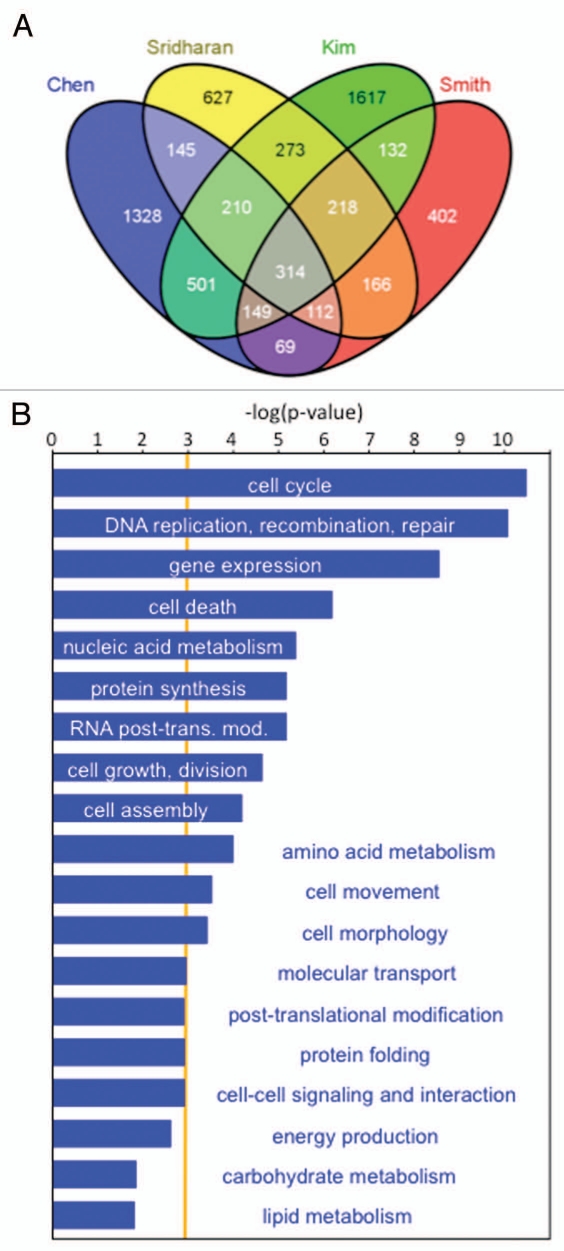
Figure 1.
In vivo target genes for c-myc in mESCs. (A) Venn diagram constructed as in reference 53 showing the proportion of Myc target genes common to four genome-wide ChIP studies.20–22,25 314 target genes are found to be c-myc target genes in all four studies. (B) Functional annotation of target genes found in all four datasets indicates enrichment primarily for regulators of the cell cycle, gene expression, genomic maintenance and metabolic activities. Data were analyzed through the use of Ingenuity Pathways Analysis (Ingenuity® Systems, www.ingenuity.com). The orange line represents the cut-off for statistical significance (p-value-0.001). The x-axis denotes—(log) significance where longer bars represent greater enrichment of specified functional categories.

