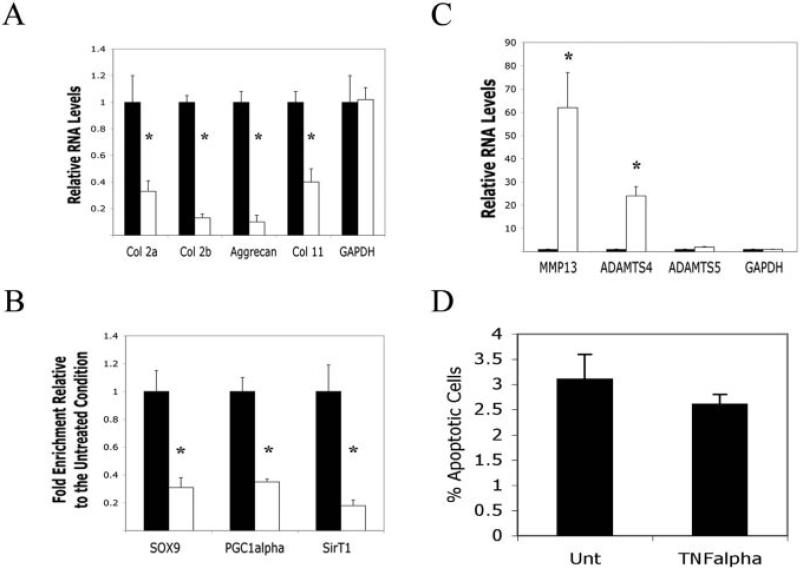
Figure 1.
Repression and activation of gene expression in human chondrocytes treated with tumor necrosis factor α (TNFα). A, Relative RNA levels in chondrocytes left untreated (solid bars) or treated with TNFα (open bars), as determined by quantitative polymerase chain reaction (qPCR) with the indicated human primers. B, Chromatin immunoprecipitation analysis of chondrocytes left untreated (solid bars) or treated with TNFα (open bars), using antibodies to SOX9, peroxisome proliferator–activated receptor γ coactivator 1α (PGC-1α), and SirT1 or a nonspecific IgG as a negative control. Quantitative PCR was performed with primers flanking the enhancer within the first intron of α2(I) collagen. An IgG control showed no PCR product. C, Relative RNA levels in chondrocytes left untreated (solid bars) or treated with TNFα (open bars), as determined by qPCR with the indicated human primers. D, Percentage of apoptotic cells in chondrocytes left untreated (Unt) or treated with TNFα (50 ng/ml) for 24 hours, as determined by flow cytometry. No significant difference between the 2 conditions was noted. Bars show the mean ± SD. * = P < 0.05 versus untreated controls.

