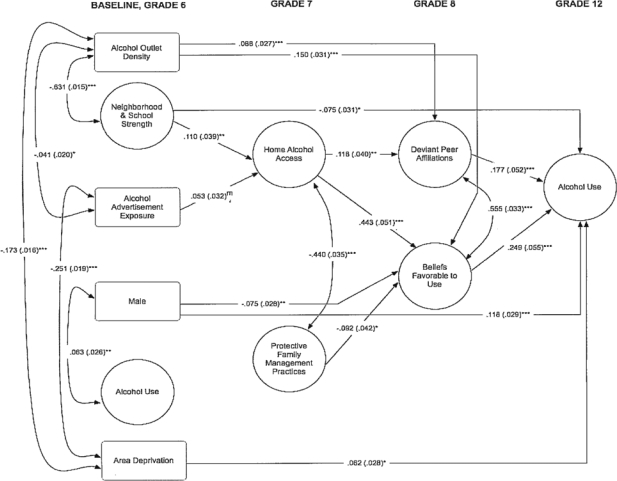
Figure 2.
African American structural model depicting standardized paths among neighborhood context, home and family management practices, deviant peer affiliations and intrapersonal beliefs, and alcohol use in young adulthood (nonsignificant paths have been removed for simplicity). Estimates are standardized and controlled for treatment-group assignment. Standard errors are in parentheses. Curved lines represent residual correlations (r) and straight lines represent regression paths (β). Comparative fit index = .937; Tucker-Lewis index = .930; root mean square error of approximation = .028; standardized root mean square residual = .038.
m.05 ≤ p ≤ .10; *p < .05; **p ≤ .01; ***p ≤ .001.

