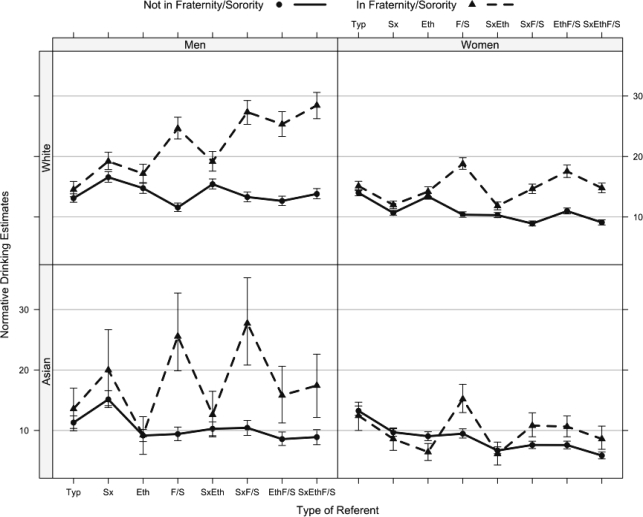
Figure 2.
Means and 95% confidence intervals for normative drinking across eight reference groups, separately for subgroups of gender, ethnicity, and fraternity/sorority status. Means and standard deviations are reported adjacent to plotted data. Acronyms for reference groups: Typ = typical; Sx = same gender; Eth = same ethnicity; F/S = same fraternity/sorority status; SxEth = same gender and ethnicity; SxF/S = same gender and fraternity/sorority status; EthF/S = same ethnicity and fraternity/sorority status; SxEthF/S = same gender, ethnicity, and fraternity/sorority status.

