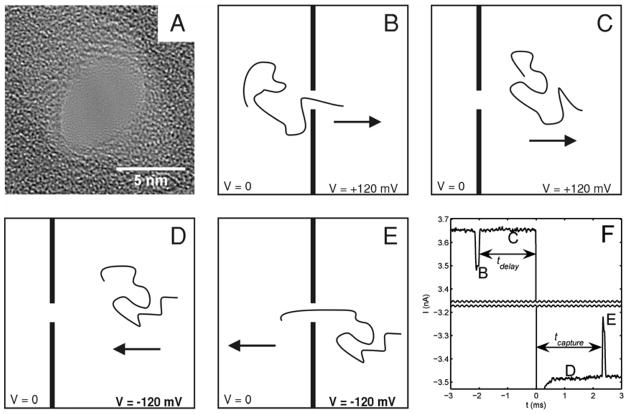
Figure 1.
Overview of the recapture experiment. A) TEM of the SiN nanopore used. B–E) Schematic representation of the experiment. The arrow represents the direction of the electric force on the DNA molecule. B) A single DNA molecule passes through the nanopore in the forward direction. C) After passing through the pore, the molecule moves away from the pore under the influence of the electric field for a fixed delay time. D) The field is reversed, and the molecule moves towards the pore. E) The molecule passes through the pore in the reverse direction. F) A representative current trace for an experiment with a 2 ms delay before voltage reversal. A gap of 6.6 nA is omitted from the middle of the trace. The letters mark the correspondence between the current trace and the schematic illustrations of molecular motion. Molecules cannot be detected passing the pore during the first 300 μs after voltage reversal while the capacitance of the nanopore/flow cell system charges.

