Figure 4.
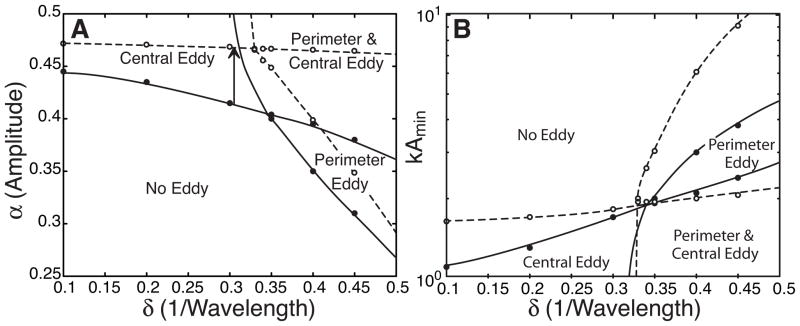
Eddy “phase” diagram (A) for various amplitudes α and aspect ratios (inverse perturbation wavelength) δ for k = 10 solid lines and k = 30 dashed lines. (B) shows the same diagram in terms of kAmin and δ. The circles are the calculated boundary points and the lines (solid for k = 10 and dashed for k = 30) represent approximate boundary lines. The diagram shows four regions: with perimeter eddies, with central eddies, both eddy types, and no eddies (unidirectional flow). The arrow indicates the shift in α and δ values needed to observe eddies for the larger k value.

