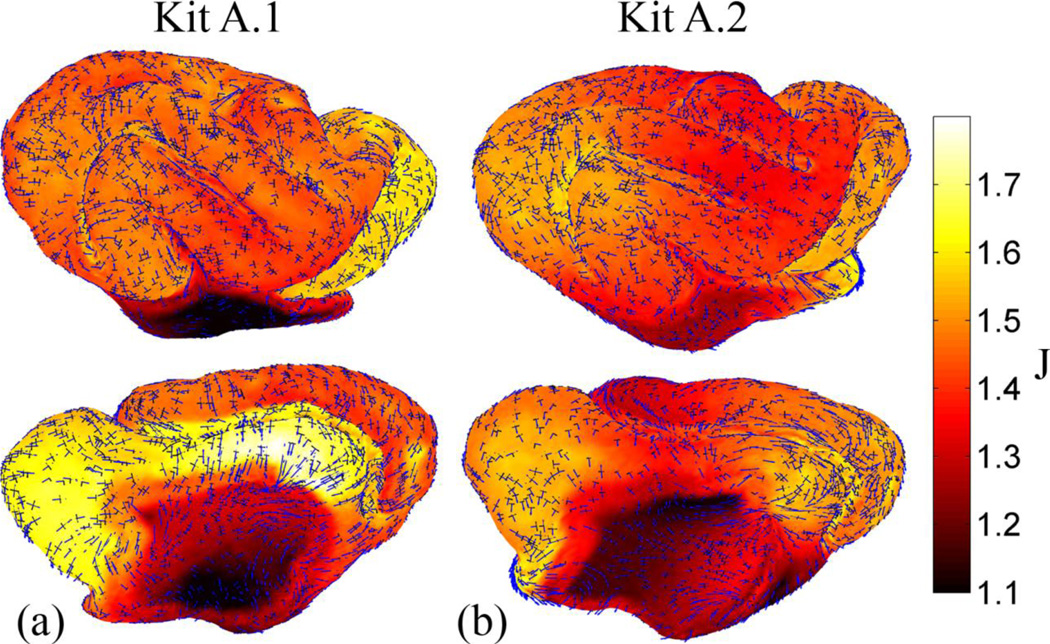
Figure 13.
Areal expansion and principal strain fields from P21 to P28 (both kits): plotted over the dilatation ration, J, are the eigenvectors associated with first (blue) and second (black) principal stretches. Vectors are scaled by their corresponding principal stretch value, and were plotted for every fifth point on the surface. Growth is smaller and more uniform during this period compared to the interval from P14 to P21, and it appears to be more isotropic.

