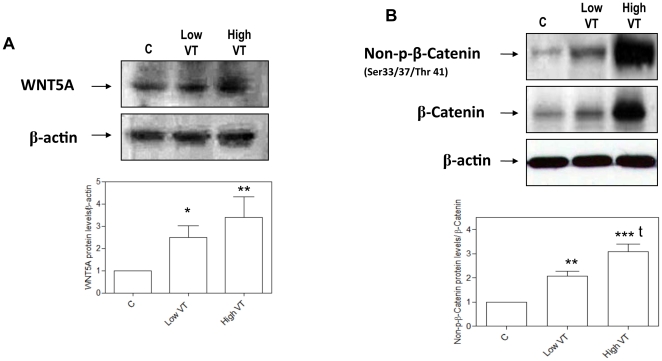
Figure 3. Representative gels for WNT5A and β-catenin activation.
Changes in WNT5A (A) and β-catenin (B) protein levels under different ventilatory strategies: spontaneously breathing animals (control, C), ventilated with low VT and ventilated with high VT. Blots were probed with WNT5A and non-phosphorylated (Ser33/37/Thr41) antibodies to β-catenin and subsequently stripped and reprobed for antibody to total β-catenin (in B) and β-actin. WNT5A densitometry bands were normalized to β-actin. Non-phosphorylated (Ser33/37/Thr41) β-catenin bands were normalized to total β-catenin and β-actin. Graphs represent data from 6 animals in each group and are expressed in relation to control, non-ventilated animals (bar C). (*) p<0.05 vs. control animals; (**) p<0.01 vs. animals ventilated with low VT; (***) p<0.001 vs. controls; (t) p<0.01 vs. animals ventilated with low VT.

