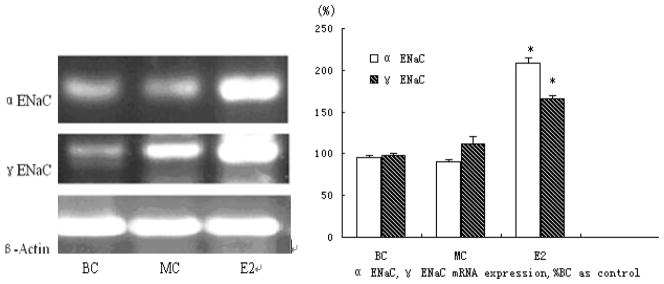
Figure 2. Analysis of ENaC mRNA expression in primary mouse osteoblasts.
Total RNAs were isolated according to manufacture instruction. Messenger RNA levels for ENaC α, γ were determined by RT-PCR. The levels of mRNA were normalized to that of 18S ribosome RNA. Three independent experiments were carried out (* represents P<0.05, ** represents P<0.01). BC, MC and E2 individually represent blank control group match control group and the estrogen (10−5 mol/L) group.

