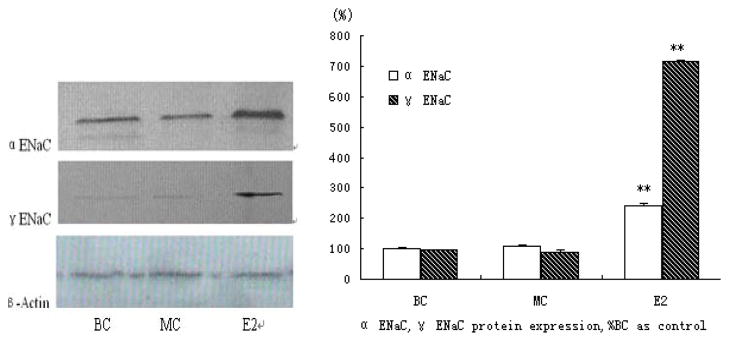
Figure 3. Analysis of ENaC protein expression in primary mice osteoblasts.
Proteins in the same condition as RT-PCR studies were extracted as methods. ENaC α, γ were determined by western-blot using immunopurified anti-goat ENaC antibodies. The levels of proteins were normalized to that of β-actin as an internal standard. No background staining was seen when omitting the primary antibody (data not shown) (* represents P<0.05, ** represents P<0.01).

