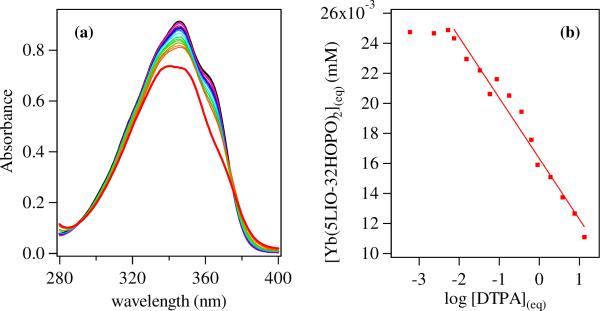
Figure 3.
(a) Absorption spectra (left) for solutions of [Yb(5LIO-Me-3,2-HOPO)2]− (26 μM in 0.1 M KCl; 0.01 M HEPES at pH 7.4; black line) and after addition of up to ca. 500 equivalents of DTPA (red). (b) Plot of equilibrium concentration (right) determined from absorption spectra versus equilibrium concentration of log DTPA (mM−1) and corresponding fit used to evaluate equal speciation between 5LIO-Me-3,2-HOPO and DTPA (i.e. 50 % [Yb(DTPA)] at ca. 0.013 mM, which corresponds to a pYb = 18.8 (1) for the [Yb(5LIO-Me-3,2-HOPO)2 complex.

