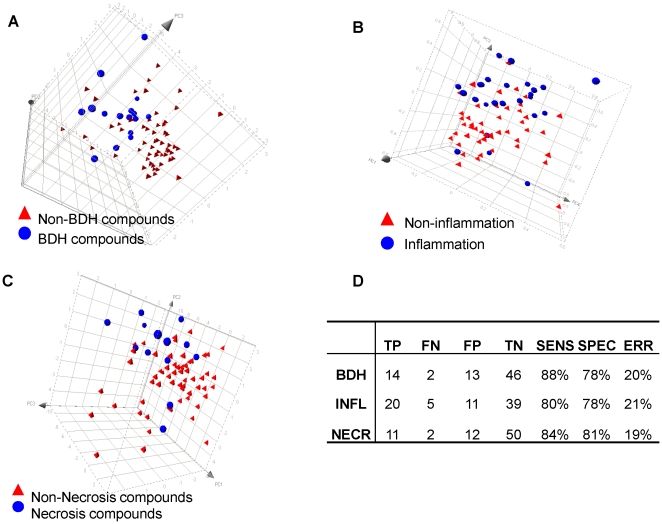
Figure 6. Validation with an independent dataset.
Visual representation of PCA results for the top 10 genes in the BDH (A), INFL (B), and necrosis (C) signatures validated with independent samples. The result shows a clear separation between positive and negative compounds; (D) a SVM classifier performance matrix shows that a reasonable sensitivity (from 80% to 88%) and specificity (from 78% to 81%) have been achieved for each model. TP - True Positive; FN - False Negative; FP - False Positive; TN - True Negative; SENS - Sensitivity; SPEC - Specificity; ERR - Error rate; NECR - Necrosis.

