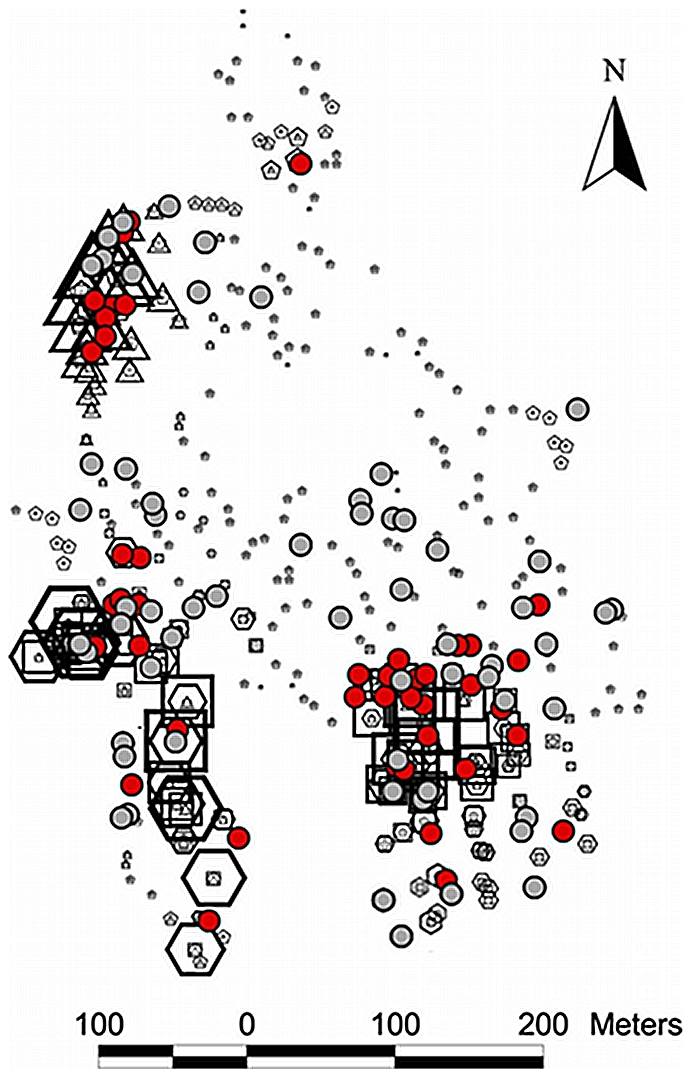
Figure 3. Estimated geographic position of introductions of Trypanosoma cruzi into the community of Guadalupe, Arequipa, Peru.

The probability that each household was the first (hexagons), second (triangles), third (squares) or fourth (pentagons) site of introduction under the four-epicenter model is shown. Larger shapes correspond to higher probabilities. Households with cases of human disease are shown as red circles, and those with vectors carrying T. cruzi are shown in grey circles. The following steps were taken to protect patient anonymity in making this map: The geographic position of human cases has been slightly and randomly perturbed; the positions of some uninfected households have been altered; and certain regions of the map have been rotated a random angle around their centroid.
