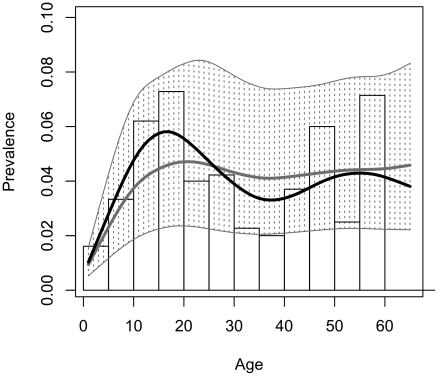
Figure 4. The observed and predicted relationship between age and prevalence of Trypanosoma cruzi infection in Guadalupe, Arequipa, Peru.
The histogram represents the observed data; a smoothed spline, weighted by the number of observations at each age, is fit to these data (black curve). Model estimates of the relationship between age and prevalence were calculated by determining the probability of infection for each individual derived from the posterior predictions of the epicenter regression model with four epicenters. The spline fit to the median posterior predictions is surrounded by a region bounded by splines fit to predictions from the 2.5% and 97.5% quantiles of the posterior (light grey, shaded).

