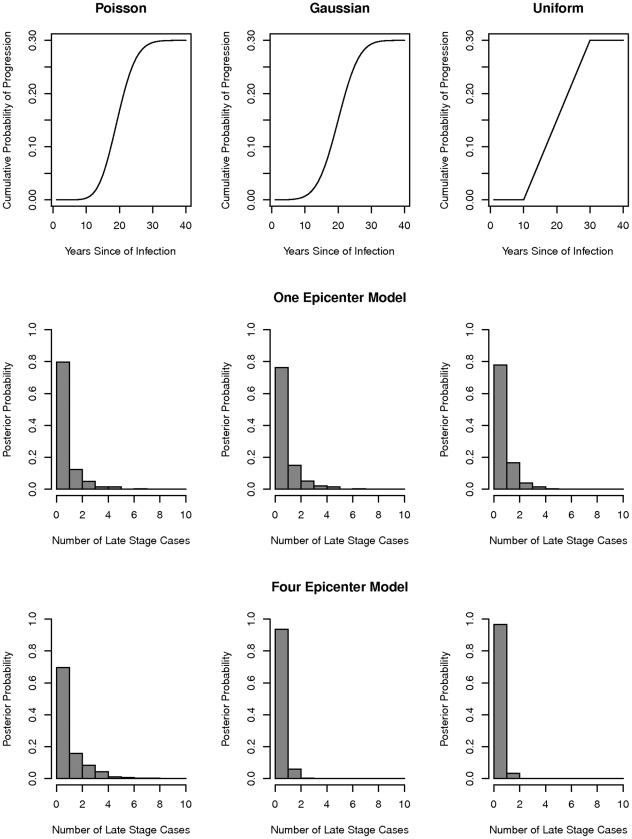
Figure 5. The expected number of cases of late-stage Chagas disease among individuals infected with T. cruzi in Guadalupe, Arequipa, Peru in 2004.
Top row: three alternative models to describe the probability of onset of late-stage disease as a function of time (see text). Histograms represent the posterior expected number of late stage cases under the four-epicenter model (middle row) and one-epicenter model (bottom row).

