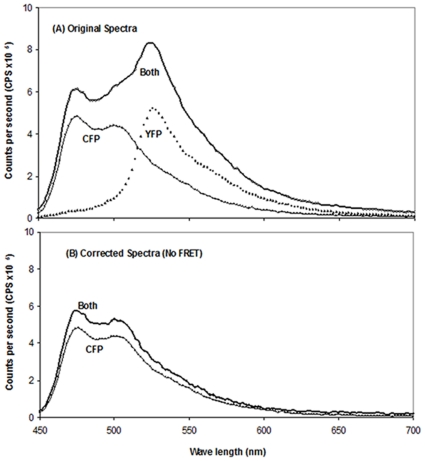
Figure 1. Fluorescence spectra of purified Peak 1 CFP-IIGlc plus Peak 1 YFP-IIGlc mixture, purified Peak 1 CFP-IIGlc and purified Peak 1 YFP-IIGlc.
(A) The two fluorescent proteins were not detergent-treated, but were mixed before purification at a 1:6 ratio (Both; dark line). Alternatively, the spectrum of pure Peak 1 CFP-IIGlc (CFP, light line) or pure Peak 1 YFP-IIGlc (YFP, dotted line) alone was measured. (B) The spectrum of the YFP-IIGlc protein was subtracted from the spectrum of the Peak 1 CFP-IIGlc - Peak 1 YFP-IIGlc mixture (Both corrected, dark line). The purified CFP-IIGlc spectrum is also shown (CFP, light line). (No FRET was observed).

