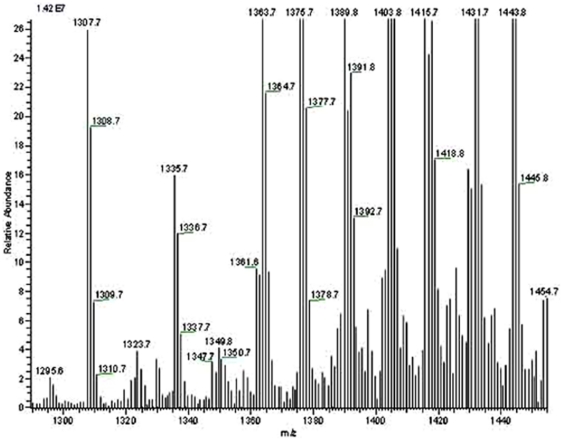
Figure 18. LC-ESI-MS negative ion mode spectra of cardiolipin (CA) molecular species of lipid extract of peak 1 fraction of E. coli strain BL21DE3(pMALE-ptsG).
Arrows indicate different CA molecular species detected in peak 1 and standard preparations (for standard preparation see Figure S12 at Saier web site). I.S., internal standard; right handed numbers at the top of the Y axis indicate full-scale intensity in arbitrary units. The lipid contents of E. coli strain BL21DE3(pMALE-ptsG) were extracted and analyzed as described in Materials and Methods.

