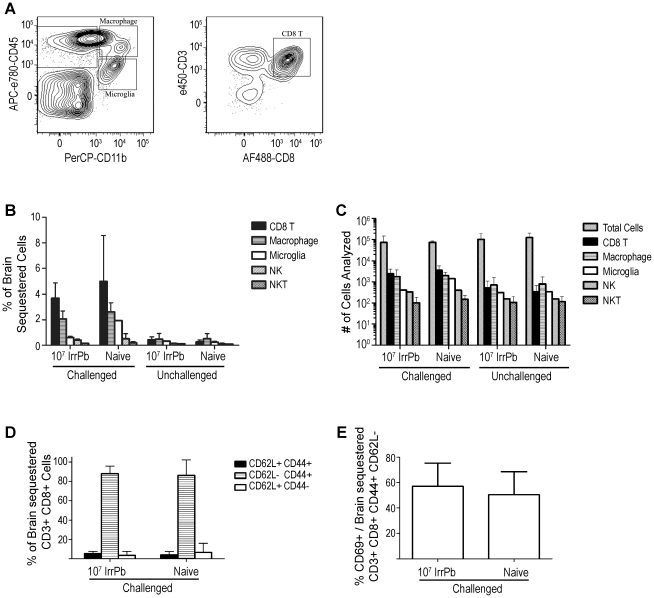
Figure 6. Flow cytometry analysis of cell subtypes in brains of mice immunized with 107 IrrPb.
Brain samples were processed on day 6 after virulent challenge and were pooled from all 4 mice in each group. Results are combined from two independent experiments. A) Representative cell plots from naïve mouse brain samples during a virulent infection. Gates for macrophages (CD45+, CD11b+), microglia (CD45int, CD11b+), and CD8 T cells (CD45+, CD3+, CD8+) are indicated. B) Graph of brain sequestered cell frequencies. Naïve mice had increased frequencies of brain-sequestered CD8 T cells and macrophages during a virulent challenge (Naïve Challenged, black and hatched bars). Immunized challenged mice displayed frequencies of brain-sequestered CD8 T cells and macrophages that were similar to frequencies observed in naïve mice during a challenge (107 IrrPb Challenged, black and hatched bars). The mean difference in brain-sequestered CD8 T cells from 107 IrrPb challenged vs. naïve challenged mice was −.9 (−2.8, 1.0)%, p = .12, Two Way ANOVA. C) Graph of the number of cells analyzed for each group. The absolute numbers of total cells and CD8 T cells analyzed were not significantly different between the 107 IrrPb immunized and naïve groups, p>.5, Two Way ANOVA. D) Brain-sequestered CD8 T cells from both immunized and naïve mice largely had a CD44+ CD62L− effector phenotype (hatched bars), and E) approximately 55% of these effector cells were also CD69+ in both Naïve mice and 107 IrrPb immunized mice after challenge.

