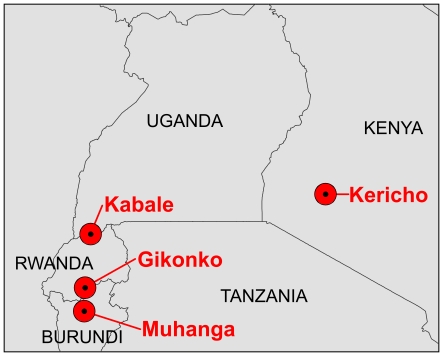
Figure 1. Location map.
Sites at which monthly temperature data were analyzed are shown in red. Countries for which P. falciparum parasite rate data were analyzed are labeled. The map extent exactly matches the area defined by Patz et al. [19] across which CRU TS 2.1 and 3.0 data were tested: 4°S, 4°N, 28°E, 38°E.

