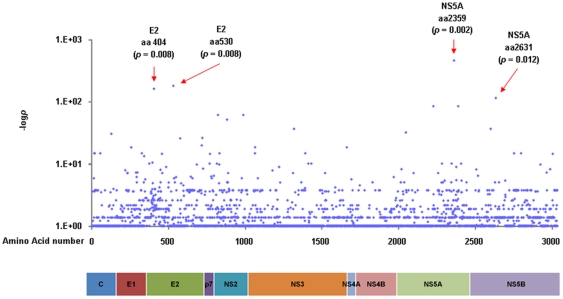
Figure 3. Different amino acid usage at each viral amino acid position between the sustained virological responders (SVR) and the non-sustained virological responders (non-SVR) patients.
(a) Different amino acid usage at each viral amino acid position between the SVR and the non-SVR patients was analyzed by Fisher's exact probability test. The longitudinal axis shows the −logP value. (b) Sequence alignment in the Core region is demonstrated. Dashes indicate amino acids identical to the consensus sequence and substituted amino acids are shown by standard single letter codes.

