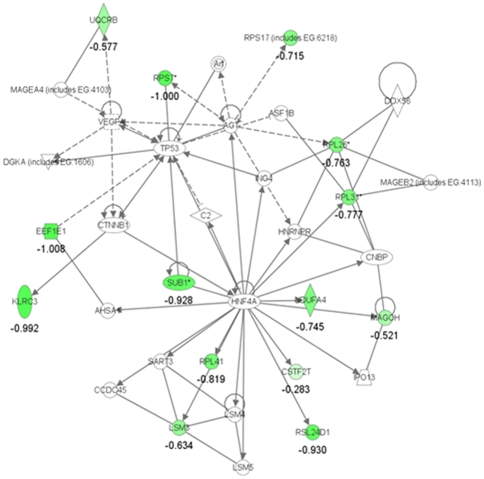
Figure 2. Ingenuity pathway analysis of differentially expressed genes for the asdMO group compared with the ctrlMO group.
The top scored network using the 57 genes identified as differentially expressed genes for the asdMO group (> 2-fold vs. ctrlMO) is “cancer, RNA post-transcriptional modification, reproductive system disease”, with 14 focus molecules and a score of 27. The color intensity indicates the genes up-regulated or down-regulated in asdMO are shown in red or green, respectively. The mean of log2 expression values compared with the ctrlMO group are described as logarithm scale.

