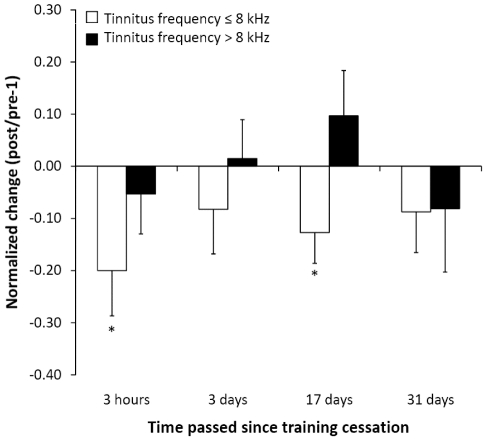
Figure 1. Tinnitus loudness ratios.
Normalized tinnitus loudness changes relative to baseline at four time points after training completion for both patient groups. White bars represent the low tinnitus frequency (≤8 kHz) group, black bars represent the high tinnitus frequency (>8 kHz) group. Asterisks denote significant changes, the error bars denote standard errors of the mean. Positive values indicate aggravation, and negative values indicate alleviation.

