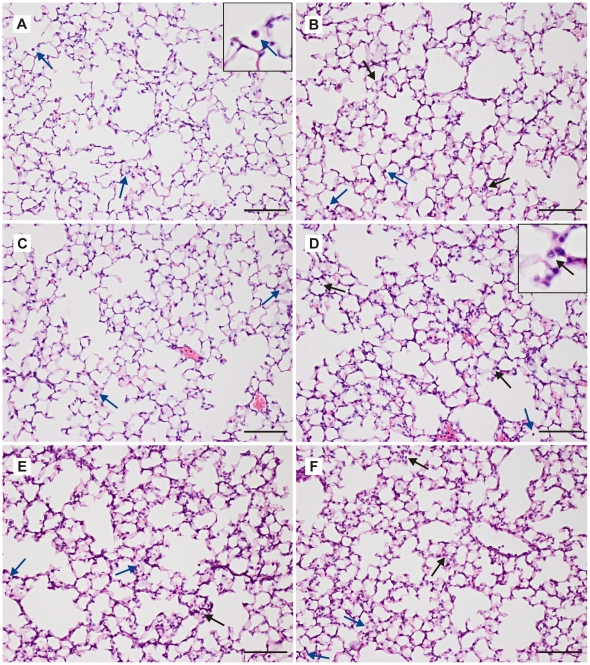
Figure 7. Lung histopathology.
Representative lung sections stained with hematoxylin and eosin from: A. unventilated control, B. lowVTRM60, C. lowVTRM5, D. highVTRM5, E. lowVTnoRM and F. highVTnoRM mice. Black arrows indicate neutrophils; blue arrows indicate intra-alveolar monocytes and macrophages, scale bars 100 µm; magnification 200x. Insets in A and D contain enlarged images of exemplary leukocytes.

