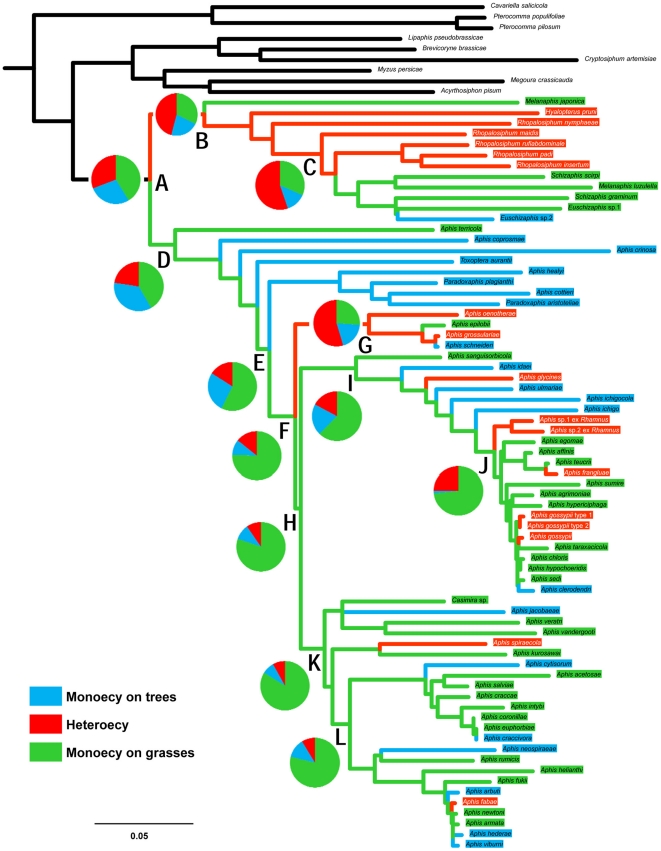
Figure 3. Ancestral state reconstruction for host alternation.
The ancestral states are classified into monoecy on trees (blue), heteroecy (red), and monoecy on grasses (green). The topology is derived from the ML tree of Figure 1. Pie charts indicate the relative likelihoods at respective nodes (A–L). Terminal taxa and their respective branches are color-coded for state of host use. The scale is a nucleotide substitution rate of 0.05.

