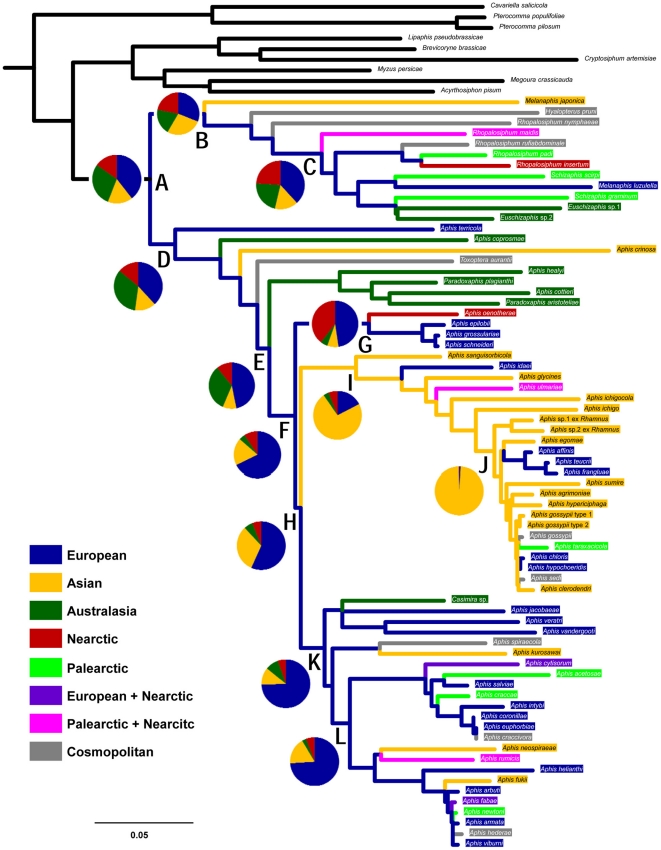
Figure 4. Ancestral state reconstruction for biogeographic origin.
The topology is derived from the ML tree of Figure 1. Pie charts indicate the relative likelihoods at respective nodes (A–L). Terminal taxa and their respective branches are color-coded for state of host use. The scale is a nucleotide substitution rate of 0.05. Palearctic, European+Nearctic, Palearctic+Nearctic, and cosmopolitan states were coded as multistate and thus do not appear in pie charts.

