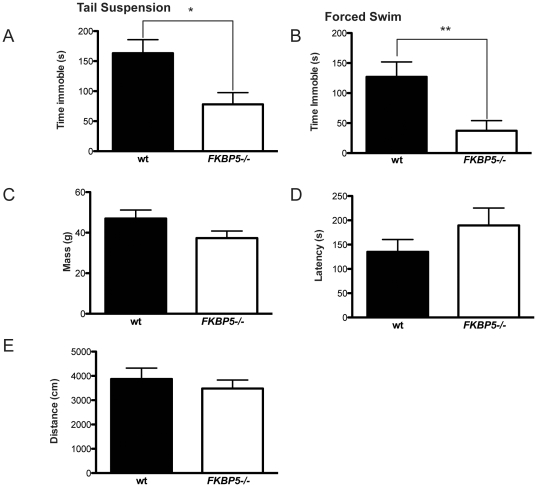
Figure 2. FKBP5−/− mice display resistance to depression inducing stimulus.
(A) Total time immobile in the tail suspension test; *p<0.05, t = 2.870, df = 16. (B) Total time immobile in the forced swim test; **p<0.01, t = 2.982, df = 16. (C) No significant difference was observed between mass measurements of groups. (D) Latency to fall from a gradually accelerating rotorod apparatus displays no difference between groups. (E) Activity levels in the open field display no differences between groups.

