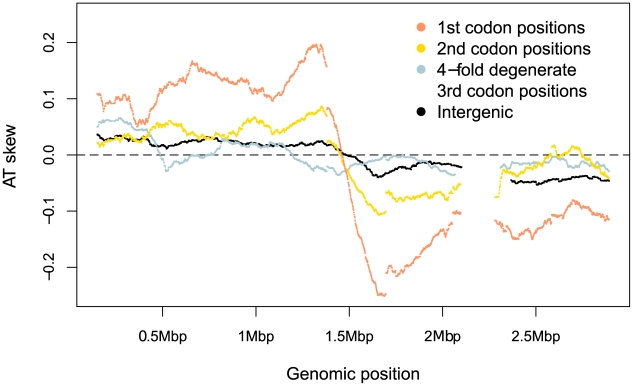
Figure 3. S. aureus AT skews in different sites along the genome.
Skew was calculated with respect to the published strand using overlapping windows of 300kb and 1 kb steps where a data point was plotted if the number of bases in a window reached at least 30,000. Codon positions were demarcated along the published (Watson) strand and skews in these positions were plotted using the sequence in this single DNA molecule without respect to whether the gene is encoded on the leading or lagging strand.

