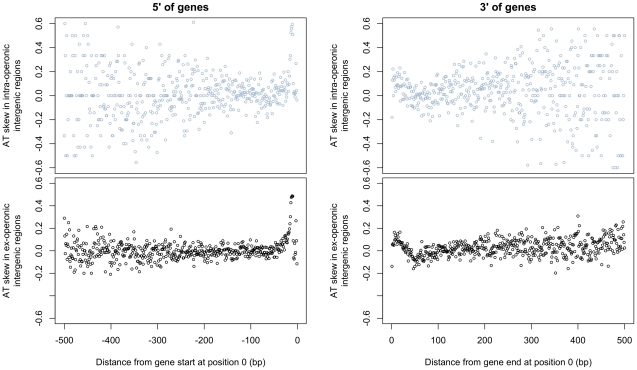
Figure 4. AT skew displays local abnormalities at intergene boundaries but grows neither A nor T rich at increasingly distant positions from gene starts and ends.
AT skew at each position was calculated from the nucleotide content measured across all intra- or ex-operonic intergenic regions at that position relative to the gene start or end as appropriate. All intergenic regions were considered in the direction of transcription of the relevant gene, and similar results are obtained when only UTRs of leading strand genes are considered (latter not shown). The effects on AT skew are similar between ex-operonic and intra-operonic intergenic regions for regions both 5′ and 3′ of genes, with more noise apparent at further distances in the intra-operonic regions due to increasingly smaller sample sizes. 5′ of genes. With increasing distance 5′ of gene starts, AT skew first increases before it decreases. 3′ of genes. Starting at gene ends, AT skew becomes more positive before it decreases again, becoming briefly negative before levelling out.

