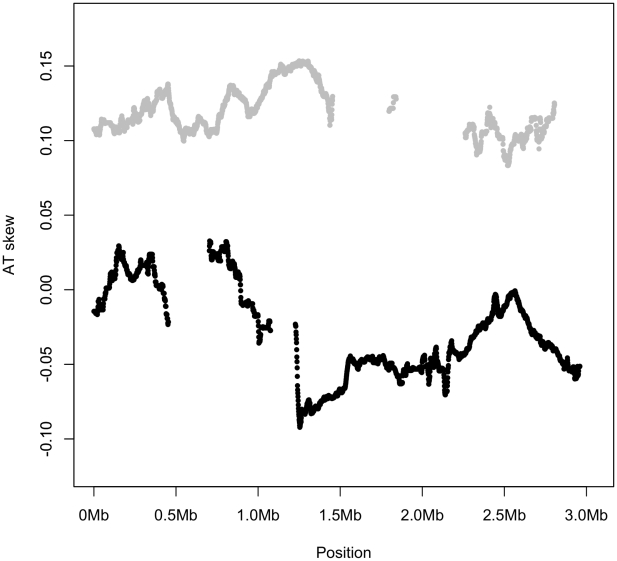
Figure 5. AT skew is similar along the entire length of genome for all noncomplementary genes (gray), while all complementary genes (black) display a similar AT skew.
Genic AT skew was calculated with respect to the published strand, using overlapping windows of 300 kb and 1 kb steps where a data point was plotted if the number of bases in protein-coding genes in a window reached at least 30,000. Thus the skew shown for the noncomplementary genes (gray) corresponds to their coding sense direction whereas the skew shown for complementary genes (black) corresponds to their coding antisense direction. Skews were plotted this way to visually distinguish between different segments of the replicatory strands. If AT skew were primarily induced by replication, leading strand genes (the first half of the gray strand and the second half of the black strand) should show similar skews, and lagging strand genes should show roughly uniform skews opposite in sign to the leading strand genic skews. However this is not the case and S. aureus genes show AT skew corresponding to the direction in which they are transcribed, or the direction in which their amino acids are encoded.

