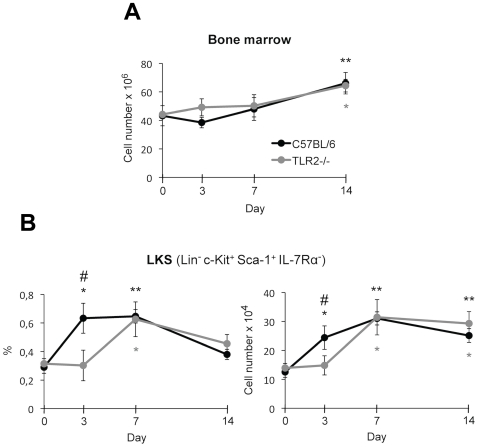
Figure 2. LKS cells in bone marrow of C. albicans infected mice.
C57BL/6 and TLR2−/− mice (n = 20) were injected intravenously with 1.5×10⁶ yeasts of C. albicans PCA2 per mouse. Three mice of each group were killed at days 3, 7 and 14 post-infection, and bone marrow cells were isolated, erythrocytes were lysed and cells were microscopically counted (total nucleated bone marrow cells) (A), labelled with various combinations of antibodies and analyzed by flow cytometry to assess the changes in LKS population (expressed both as percentage of total bone marrow cells and as total LKS cells (B). Data represent means ± SD (n = 3), from one representative experiment of two. * P<0.05, ** P<0.01 when each day is compared with day 0 (uninfected mice). # P<0.05 when TLR2−/− mice are compared with the wild-type mice.

