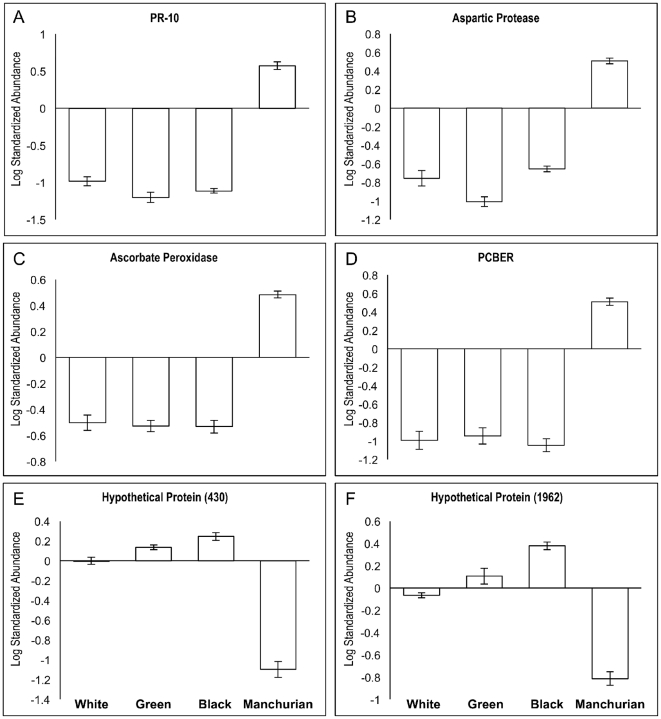
Figure 4. Bar graphs of mean log standardized abundance (LSA) values for the proteins shown in Tables 2 and 3 .
Panels A, B, C, D: Proteins expressed at higher levels (> 5-fold; P<0.01) in resistant Manchurian (M) ash than in susceptible North American black (B), white (W), and green (G) ash. Panels E and F: Proteins expressed at higher levels (> 5-fold; P<0.01) in susceptible black, green, and white ash than resistant Manchurian ash. Bars represent the mean of eight biological replicates within a genotype/species, while error bars represent the standard error of the mean (s.e.m.). The zero value for LSA corresponds to the internal standard (IS). N = 8, except in Manchurian ash PR-10, where n = 7 due to a lack of a match for this protein in gel 1 (Table S1) to the master gel image.

