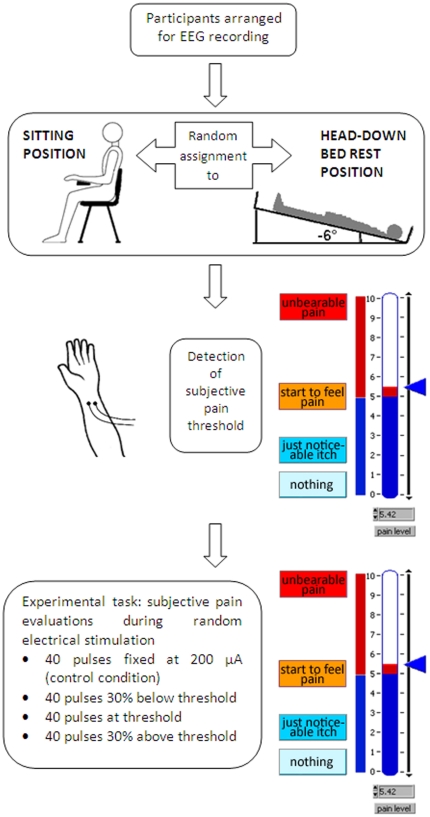
Figure 1. Schematic diagram of experimental design and procedure.
After EEG preparation (top row), participants were randomly assigned to sitting or bed rest position (control and experimental group, respectively; second row). Two surface gold electrodes were applied on the internal left wrist and participants' electric pain threshold was computed by means of a 10-point visuo-analogue scale representing different levels of pain intensity (third row). Participants started the experimental task which consisted in the EEG recording and subjective pain evaluations during pseudo-random administration of four different levels of electrical intensities (bottom row).

