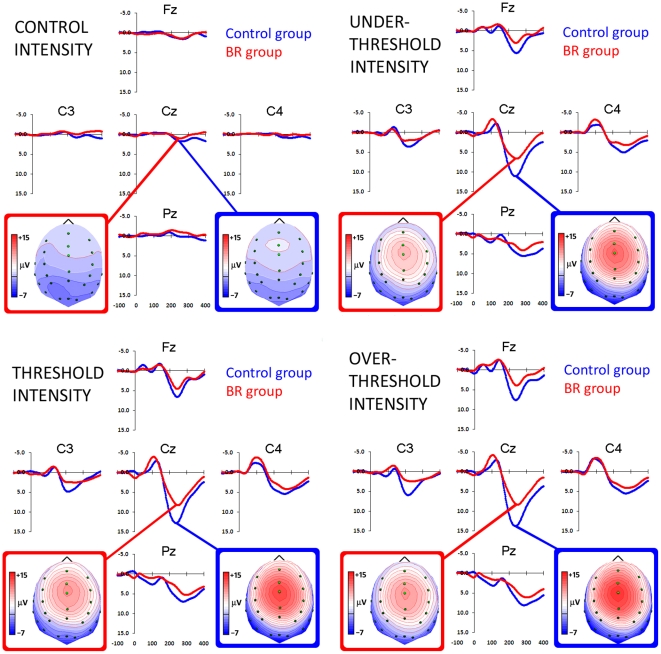
Figure 2. Group-level grand-average waveforms of selected electrodes (in correspondence of the somatosensory cortex) showing the time-course of somatosensory processing (top row) during Control and Under Threshold conditions (left and right panel, respectively), and pain processing (bottom row) during Threshold and Over Threshold conditions (left and right panel, respectively) in sitting controls (blue line) and Bed Rest participants (red line).
Negativity is displayed upward. Spline interpolated maps of potentials representing scalp top views of P2 component (190–220 ms) in the four different conditions are depicted in blue and red boxes for control and Bed Rest groups, respectively.

