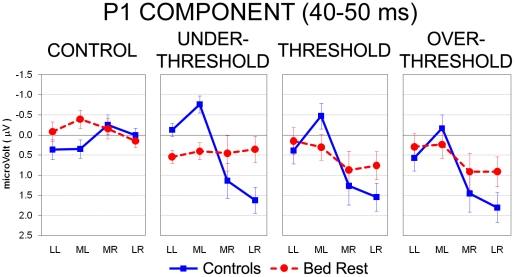
Figure 3. Analysis of P1 component during the 40- to 50-ms epoch after electrical stimuli: significant three-way Group by Stimulus Intensity by Laterality interaction.
Mean activity and Standard Error (SE) are depicted for Control (blue bars) and Bed Rest group (red bars). Control group (blue line) showed greater positivity on right vs. left clusters of electrodes (contralateral to the side of stimulation) for Under Threshold, Threshold and Over Threshold intensities, whereas BR group (red dotted line) revealed no difference among the four stimulus conditions.

