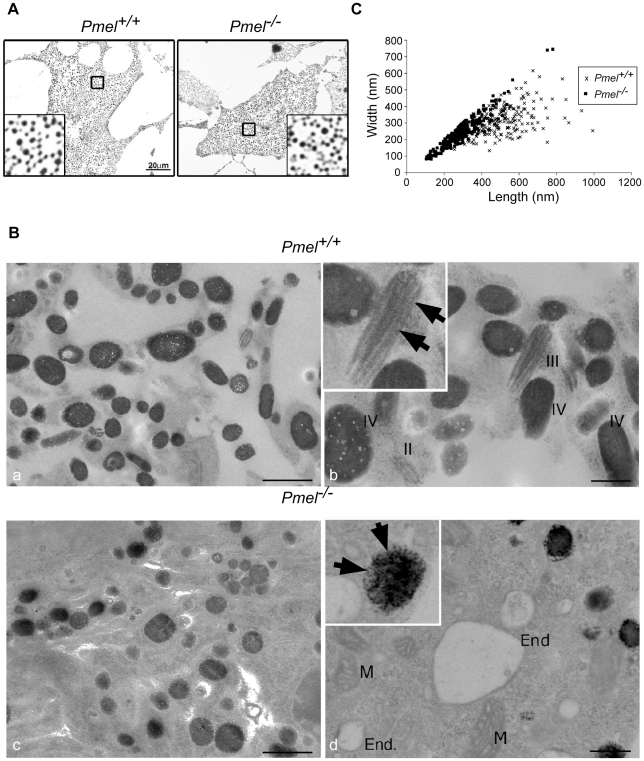
Figure 2. Morphology of melanosomes observed in primary cultures of skin-derived melanocytes from wild-type C57BL/6 (Pmel+/+) and Pmel−/−mice.
(A) Bright-field microscopy; scale bar, 20µm; inset, 5X magnification. Note that the distribution of melanosomes is similar in both sets of melanocytes. (B) Electron microscopy. Cross-sections of melanosomes in the Pmel+/+ melanocytes are both spherical and rod shaped, whilst they are only spherical in the Pmel −/− melanocytes. I, II, III, and IV represent stage I, II, III, and IV melanosomes. M, mitochondria; End, endosomes. Note the presence of fibrillar stage II and III melanosomes in the wild-type melanocytes (panel Bb, marked with arrowheads in inset) in contrast to the granular deposits of melanin in Pmel −/− melanosomes (panel Bd, marked with arrows in inset). Bars: 500 nm and 200 nm, in left and right panels respectively (C) Plot of the diameters of melanosomes along the long (length) and short (width) axes measured from electron microscopy images; n>200 for both genotypes. There was a weak correlation between the length and width of melanosomes in Pmel+/+ cells (r = 0.52), consistent with their ellipsoidal shape, whereas in Pmel −/− cells, there was a strong correlation (r = 0.93), indicating a spherical shape. The difference in the length/width ratio between wild-type and Pmel −/− is overwhelmingly significant (Analysis of variance; F = 161, d.f.1 = 1, d.f.2 = 451; P<10−6).

