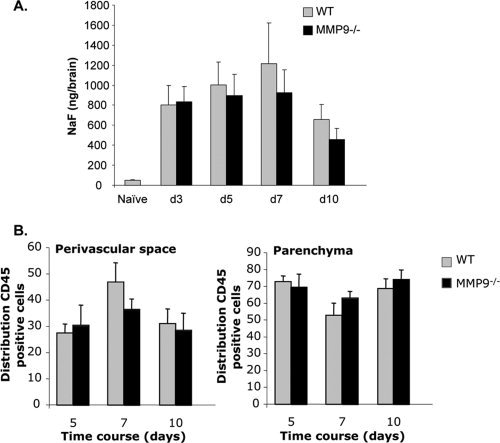
Figure 3.

BBB disruption and CNS leukocyte distribution are identical in MMP9−/− mice and controls. A: BBB permeability was assessed by NaF. Data represent the average NaF amount per brain (±standard deviations) from nine mice per time point from three individual experiments. B: Leukocyte distribution in the perivascular space versus parenchyma was quantified in brain sections of infected WT and MMP9−/− mice using anti‐CD45 and anti‐laminin Abs. Ten pictures per animal were analyzed between days 5 and 10 p.i. Data represent the mean (±standard errors) of three animals per group per time point.
