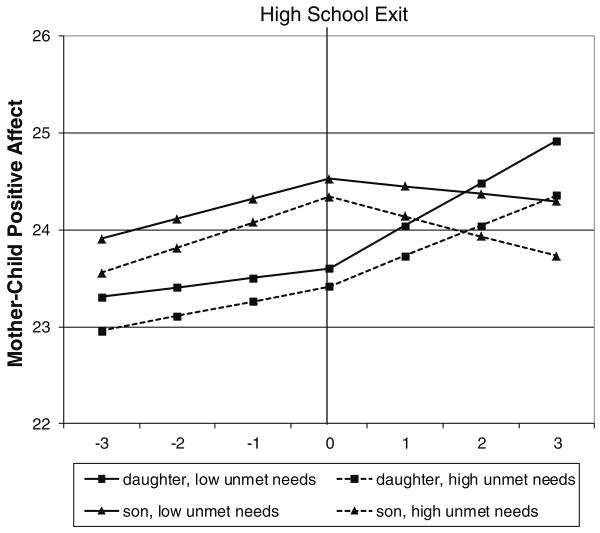
Fig. 1.
Conditional growth curve model for mother–child positive affect with significant between-persons covariates depicted. Triangles represent sons with ASD and squares represent daughters. Solid lines represent those with low unmet service needs (25th percentile or 1 unmet need) and dotted lines represent those with high unmet needs (75th percentile or over 3 unmet needs)

