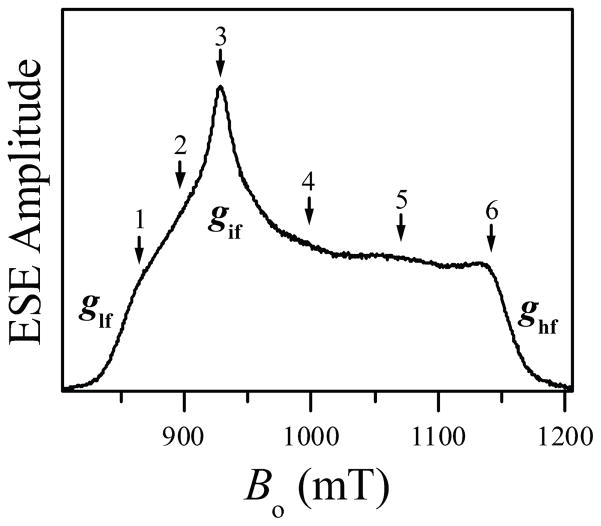
Figure 2.
Three-pulse ESE field sweep spectrum of human iNOS oxyFMN with heme coordinated by imidazole. Experimental conditions: mw frequency, 29.966 GHz; mw pulses, 311 ns; time interval between the first and second mw pulses, τ= 180 ns; time interval between the second and third mw pulses, T = 4 μs; temperature, 10 K. Principal g-values corresponding to the low-field, intermediate-field and high-field turning points are denoted glf, gif, and ghf, respectively. The numbered arrows indicate the EPR positions used for pulsed ENDOR measurements; positions 1 through 6 correspond to Bo = 864.8, 897.8, 928.8, 999.8, 1070.3, and 1141.8 mT, respectively. The numbering of the arrows corresponds to that of the traces in the subsequent figures with ENDOR spectra.

